
How to Measure Social Media ROI: The Complete 2026 Guide to Proving Your Social Media Value
Quick Answer
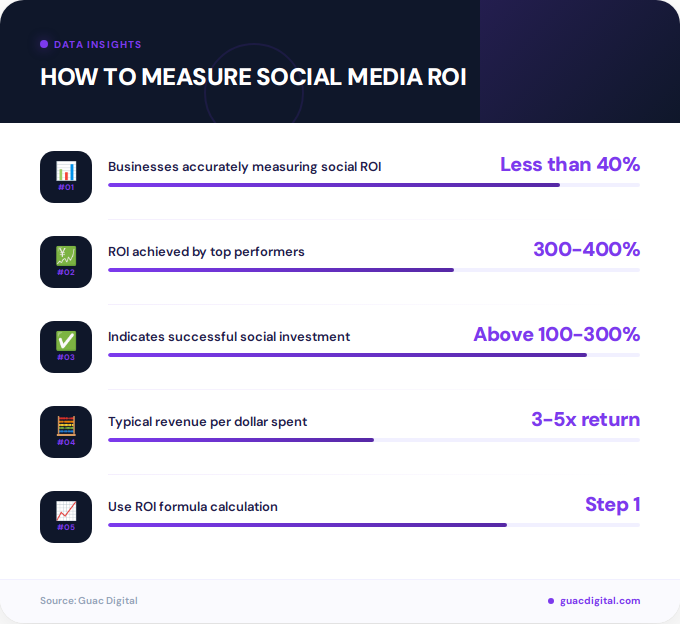
To measure social media ROI, use the formula: ((Revenue or Value Generated – Total Costs) / Total Costs) × 100. Track content performance metrics like engagement rate, website traffic and conversions from social channels, then attribute revenue to calculate your percentage return. A positive ROI above 100-300% indicates successful social media investment.
Are you spending thousands on social media marketing without knowing if it’s actually profitable? You’re not alone. Despite businesses pouring resources into social platforms, less than 40% can accurately measure their social media ROI, leaving marketing budgets vulnerable to cuts when leadership demands proof of value.
Learning how to measure social media ROI isn’t just about tracking likes and shares anymore. In 2026, businesses achieving 300-400% ROI share a common trait: they’ve mastered connecting social activity to actual revenue. This comprehensive guide shows you exactly how to calculate your return, which metrics matter, and how to prove your social media efforts drive real business results.
Whether you’re justifying your marketing budget or optimizing campaign performance, understanding social media ROI transforms social platforms from experimental channels into accountable revenue drivers.
What Is Social Media ROI and Why Does It Matter?
Social media ROI (Return on Investment) quantifies the financial value your social media activities generate compared to what you spend on them. Unlike vanity metrics such as follower counts or post likes, ROI focuses on tangible business outcomes: revenue, leads, customer acquisition, and long-term customer value.
Why does measuring social media ROI matter so critically? First, it provides budget justification. When you can demonstrate that every dollar invested in social media returns $3 or $5 in revenue, securing and expanding budgets becomes straightforward. Second, ROI measurement enables strategic optimization, revealing which platforms, content types, and campaigns deliver results versus those draining resources.
According to research from MIT Sloan Management Review, companies that effectively measure social media ROI can make data-driven decisions about resource allocation, moving beyond gut feelings to evidence-based marketing on social media.
What Is the Core Formula for Measuring Social Media ROI?
The fundamental formula for calculating how to measure social media ROI remains consistent across industries:
This calculation produces a percentage that immediately shows profitability. Positive values above 0% indicate your social efforts generate more value than they cost. Values above 100% mean you’re doubling your investment, while negative values signal the need for strategic adjustments.
Total costs include all social media expenses: paid advertising spend, content creation costs, social media management tools, agency fees, employee salaries (prorated for time spent), influencer partnerships, and asset production. The comprehensive approach recommended by Hootsuite ensures you capture the true investment picture.
Revenue or value generated encompasses direct sales attributed to social channels, lead value based on conversion rates and average deal size, customer lifetime value for acquired customers, cost savings from social customer service, and brand awareness value (though harder to quantify).

What Are the Three Essential Tracking Layers?
Effective social media ROI measurement requires tracking metrics across three interconnected layers that progressively connect social activity to business outcomes:
Layer 1: Content Performance Metrics
Reach and impressions form the foundation. Reach measures unique accounts seeing your content, while impressions count total displays (including multiple views by the same user). These top-funnel metrics indicate audience exposure potential.
Engagement rate reveals how compelling your content is, calculated as: (likes + comments + shares + saves) ÷ reach × 100. Platform-specific engagement benchmarks vary, with Instagram averaging 1-3% for most industries, while LinkedIn typically sees 0.5-1%.
Follower growth tracked weekly or monthly shows audience building momentum. However, quality matters more than quantity, focus on attracting your target demographic rather than vanity numbers.
Layer 2: Website and Funnel Metrics
Once content captures attention, track how users move toward conversion. Social-referred traffic measures sessions originating from social platforms, visible in Google Analytics under Acquisition > All Traffic > Source/Medium.
Implement UTM parameters on all social links to track specific campaigns, posts, and platforms. This granular data shows which social efforts drive qualified traffic versus casual browsers.
Goal completions tie social traffic to valuable actions: newsletter sign-ups, ebook downloads, demo requests, or purchases. Without tracking conversions, you can’t calculate true ROI.
Layer 3: Revenue and Pipeline Attribution
The final layer connects social activity to revenue. Track attributed revenue from social channels, customer acquisition cost (CAC) for social-sourced customers, and customer lifetime value (CLV) to understand long-term profitability.
Self-reported attribution captures dark social influence. Add “How did you hear about us?” fields in forms and CRM systems, as many customers research on social media before converting through other channels.
| Tracking Layer | Primary Purpose | Key Metrics |
|---|---|---|
| Content Performance | Measure audience engagement | Reach, engagement rate, follower growth |
| Website/Funnel | Track conversion journey | Social traffic, goal completions, UTM data |
| Revenue/Pipeline | Calculate financial return | Attributed revenue, CAC, CLV, ROI percentage |
Which Metrics Should You Track for Social Media ROI?
Beyond the three-layer framework, specific metrics provide actionable insights for optimizing your social media ROI:
Click-through rate (CTR) measures how effectively your content drives traffic: clicks ÷ impressions. Higher CTRs indicate compelling calls-to-action and relevant content for your audience. Platform benchmarks vary, with Facebook ads averaging 0.9% CTR and LinkedIn ads around 0.4%.
Conversion rate shows the percentage of social visitors who complete desired actions. Calculate separately for each platform to identify your highest-performing channels. If Instagram drives 1,000 visitors with 30 conversions (3% conversion rate) while Facebook delivers 2,000 visitors with 40 conversions (2% conversion rate), Instagram provides better quality traffic despite lower volume.
Return on Ad Spend (ROAS) specifically measures paid social performance: revenue from ads ÷ ad cost. A ROAS of 5:1 means every dollar spent on ads generates five dollars in revenue. While related to ROI, ROAS focuses exclusively on advertising spend rather than total costs.
The balanced approach recommended by Brandwatch emphasizes tracking both CAC and CLV together. Low customer acquisition costs combined with high lifetime value prove social media’s long-term profitability.
How Do You Attribute Revenue to Social Media?
Attribution, assigning credit for conversions to specific marketing touchpoints, presents one of the biggest challenges in measuring social media ROI. Several models exist, each with strengths and limitations:
Last-click attribution credits the final touchpoint before conversion. If a customer clicks a Facebook ad and immediately purchases, Facebook receives 100% credit. While simple, this model ignores earlier social interactions that built awareness and consideration.
First-click attribution awards credit to the initial touchpoint. If someone discovers your brand through an Instagram post, then later converts via email, Instagram gets attribution. This model values awareness building but overlooks nurturing efforts.
Multi-touch attribution distributes credit across multiple touchpoints in the customer journey. Linear models split credit equally, while time-decay models give more weight to recent interactions. U-shaped or position-based models emphasize first and last touches while acknowledging middle interactions.
For comprehensive measurement, combine UTM tracking with self-reported attribution. UTM parameters track clickable interactions, while post-purchase surveys capture untracked social influence. Many customers browse Instagram, screenshot products, then purchase days later by searching your brand directly. Without self-reported data, you’ll undervalue social impact.
Integration with CRM systems like Salesforce or HubSpot enables pipeline tracking from social engagement through closed deals, especially valuable for B2B companies with longer sales cycles. This approach helps businesses understand the full value of their efforts to increase ROI across marketing channels.
What Does Good Social Media ROI Look Like?
Real-world examples illustrate how different businesses calculate and achieve strong social media ROI:
E-commerce Campaign Example: An online retailer runs a holiday campaign generating $50,000 in attributed sales. Total costs include $10,000 in Facebook and Instagram ads, $5,000 for content creation and influencer partnerships, and $3,000 for social media management tools. ROI calculation: (($50,000 – $18,000) / $18,000) × 100 = 178% ROI.
Monthly Organic Efforts: A B2B company invests $31,000 monthly in social media (employee salaries, content production, tools) and generates $41,000 in net profit from social-attributed deals. ROI: (($41,000 – $31,000) / $31,000) × 100 = 32.3% ROI. While lower than the e-commerce example, this represents consistent, sustainable returns.
Lead Generation Campaign: A service business values qualified leads at ₹40,000 based on historical conversion rates and average deal size. After spending ₹10,000 on social advertising, they generate leads worth ₹40,000. ROI: ((₹40,000 – ₹10,000) / ₹10,000) × 100 = 300% ROI, hitting the strong benchmark range of 300-400%.
Important context: these percentages represent different business models and measurement maturity levels. New social programs might see lower initial ROI while building audience and refining targeting, while established programs with optimized funnels consistently deliver higher returns.
What Tools Help Measure Social Media ROI?
Accurate ROI measurement requires integrating data from multiple sources. Essential tools include:
Native platform analytics (Facebook Insights, Instagram Insights, LinkedIn Analytics, Twitter Analytics, TikTok Analytics) provide engagement metrics, audience demographics, and basic conversion tracking. These free tools offer platform-specific data but lack cross-platform integration.
Google Analytics tracks website traffic sources, user behavior, and goal completions. Set up goals for key conversions and segment traffic by social source to calculate channel-specific performance. Enhanced e-commerce tracking attributes revenue to specific campaigns and sources.
Social media management platforms like Hootsuite, Sprout Social, or Buffer aggregate multi-platform data in unified dashboards. Advanced features include sentiment analysis, competitor benchmarking, and custom report generation. Investment costs typically range from $50 to $500+ monthly based on features, team size, and platform integrations.
Attribution and analytics platforms such as Improvado, Supermetrics, or HubSpot Marketing Hub connect social data with CRM and revenue systems for sophisticated multi-touch attribution. These enterprise solutions cost $500 to $2,000+ monthly but provide the most comprehensive ROI visibility.
When selecting tools, prioritize integration capabilities with your existing marketing stack. The best measurement system seamlessly connects social engagement data with web analytics, CRM records, and financial systems to paint a complete ROI picture.
What Are the Biggest Challenges in Measuring ROI?
Even with the right formula and tools, marketers face several persistent challenges when measuring social media ROI:
Attribution complexity tops the list. Social media influences purchases throughout long, non-linear customer journeys. Someone might see your Instagram ad, visit your website, leave, see a retargeting ad, read reviews, then purchase weeks later via direct search. Which touchpoints deserve credit? Multi-touch attribution models help but require sophisticated tracking infrastructure.
Valuing non-purchase conversions creates difficulty for lead-based businesses. How do you assign monetary value to newsletter subscriptions, content downloads, or social followers? Calculate based on historical conversion rates: if 10% of leads convert at an average deal size of $5,000, each lead is worth $500. This approach enables ROI calculation even without immediate purchases.
Dark social (private sharing via messaging apps, email, or direct messages) hides significant social influence. When customers screenshot Instagram posts and text them to friends, or share links in WhatsApp groups, traditional tracking can’t follow. Combat this with unique discount codes for social campaigns and self-reported attribution questions.
Organic reach decline on platforms like Facebook and Instagram means fewer people see unpaid content, requiring increased ad spending to maintain visibility. This shifts the cost structure and can compress ROI if not managed strategically through conversion optimization.
Time lag between investment and returns complicates measurement. Brand awareness campaigns might not drive immediate conversions but generate returns over months. Use longer attribution windows (30, 60, or 90 days) and track cohort performance over time to capture delayed conversions.
What Are the Latest Trends in Social Media ROI Measurement?
Social media ROI measurement continues evolving in 2026, driven by technology advances and changing platform dynamics:
AI-powered analytics now automate data collection, analysis, and insight generation. Advanced platforms use machine learning to identify patterns in successful content, predict campaign performance, and recommend optimization strategies. These tools reduce manual reporting time while improving accuracy.
Privacy-first tracking has become essential as platforms restrict data access following privacy regulations. Marketers increasingly rely on first-party data collected directly from customers, server-side tracking that doesn’t depend on cookies, and modeling to estimate attribution where direct tracking isn’t possible.
Video and short-form content metrics dominate as TikTok, Instagram Reels, and YouTube Shorts drive engagement. New metrics like video completion rate, average watch time, and share rate complement traditional engagement measures. Platforms prioritize content that keeps users on-platform, requiring adjusted strategies for driving external traffic.
According to 2026 PR and marketing trends analysis, businesses are shifting focus from vanity metrics to concrete business outcomes, with social media measurement increasingly integrated into comprehensive marketing attribution frameworks.
Influencer ROI tracking has matured with specialized platforms measuring creator campaign performance through unique promo codes, affiliate links, and dedicated landing pages. This enables precise calculation of influencer partnership returns, moving beyond engagement-based compensation to performance-based models.
Social commerce integration simplifies attribution as platforms add native shopping features. Instagram Shop, Facebook Marketplace, TikTok Shopping, and Pinterest Product Pins enable purchases without leaving the platform, providing cleaner attribution than traditional click-through models.
These trends emphasize the importance of working with specialists who understand the evolving landscape, whether through platforms like Guac Digital or building in-house expertise.
Key Takeaways
- Use the standard ROI formula: ((Revenue or Value Generated – Total Costs) / Total Costs) × 100 to calculate your social media return as a percentage
- Track across three layers: content performance metrics (engagement, reach), website/funnel metrics (traffic, conversions), and revenue/pipeline metrics (attributed sales, CAC, CLV)
- Aim for 100-300% ROI as a baseline, with best-in-class social programs achieving 300-400% through proper lead valuation and customer lifetime value tracking
- Implement multi-touch attribution combined with UTM parameters and self-reported data to capture the full influence of social media across long customer journeys
- Integrate platform analytics with Google Analytics, CRM systems, and social management tools for comprehensive cross-platform ROI visibility
- Value non-purchase conversions based on historical conversion rates and average deal size to measure ROI for lead generation and awareness campaigns
- Adapt to 2026 trends including AI-powered analytics, privacy-first tracking, social commerce, and video-focused content strategies for accurate measurement
People Also Ask
What is a good ROI percentage for social media?
A good social media ROI percentage typically ranges from 100-300% for established programs, with best-in-class performance achieving 300-400%. However, acceptable ROI varies by industry, business model, and campaign objectives, with newer programs often starting lower while building audience and optimizing strategies.
How do you calculate social media ROI if you don’t sell products directly?
For businesses without direct sales, assign monetary value to conversions based on historical data. Calculate average lead value by multiplying conversion rate by average deal size, then use this to value social-generated leads. For example, if 10% of leads convert at $5,000 average, each lead is worth $500 for ROI calculations.
What’s the difference between ROI and ROAS in social media?
ROI (Return on Investment) measures total profitability including all costs: advertising, content creation, tools, and staff time. ROAS (Return on Ad Spend) specifically measures revenue generated per dollar spent on paid advertising only. A campaign might have 5:1 ROAS but lower overall ROI when accounting for comprehensive costs.
How long does it take to see ROI from social media?
Social media ROI timelines vary by strategy and industry. Paid advertising campaigns can show returns within days or weeks, while organic content strategies typically require 3-6 months to build audience and momentum. B2B companies with longer sales cycles might not see full ROI for 6-12 months as leads progress through nurturing stages.
Should you include employee salaries when calculating social media costs?
Yes, accurate ROI calculation requires including all costs, including employee salaries prorated for time spent on social media. If a marketing manager earning $80,000 annually dedicates 25% of their time to social media, allocate $20,000 as a social media cost. This prevents overestimating ROI by hiding significant labor investments.
Can you measure ROI for brand awareness campaigns?
Measuring brand awareness ROI requires tracking metrics like brand search volume increases, survey-based brand recall, share of voice, and attributing a portion of future conversions to awareness efforts. While more complex than direct response ROI, combining reach metrics with longer attribution windows and customer surveys provides reasonable awareness value estimates.
Frequently Asked Questions
What costs should I include when calculating social media ROI?+
Include all social media expenses: paid advertising spend, content creation costs (photography, videography, design), social media management tools and software subscriptions, employee salaries prorated for time spent, agency or consultant fees, influencer partnership costs, and asset production expenses. Comprehensive cost tracking prevents ROI overestimation.
How often should I calculate social media ROI?+
Calculate ROI monthly for ongoing programs and at campaign completion for specific initiatives. Monthly tracking reveals trends and enables timely optimization, while quarterly reviews provide strategic perspective on long-term performance. Annual calculations help with budgeting and year-over-year comparisons, though waiting a full year between measurements limits agility.
Which social media platform typically delivers the best ROI?+
The best ROI platform varies by industry, audience, and business model. Facebook often delivers strong ROI for e-commerce and local businesses due to robust targeting and shopping features. LinkedIn excels for B2B companies targeting professionals. Instagram works well for visual brands and younger demographics. Test multiple platforms with clear tracking to identify your highest-performing channels rather than assuming based on general trends.
What attribution window should I use for social media?+
Use 7-day click and 1-day view attribution as a baseline for direct response campaigns, but extend to 28-day or even 90-day windows for awareness campaigns and longer sales cycles. B2B businesses should use longer windows (60-90 days) to capture delayed conversions, while e-commerce can often rely on shorter windows (7-14 days) for most purchases.
How do I track social media ROI for multiple locations or franchises?+
Create separate social profiles or campaigns for each location with unique UTM parameters and tracking codes. Use location-specific landing pages, phone numbers, or promo codes to attribute conversions accurately. Social media management platforms with location-based reporting features simplify multi-location tracking, while CRM integration helps attribute in-store conversions to social efforts.
Can negative social media ROI ever be acceptable?+
Temporarily negative ROI can be acceptable during initial audience building, testing new platforms, or launching into new markets where awareness building precedes conversions. However, establish clear timelines for reaching positive ROI (typically 3-6 months) and track leading indicators like engagement growth and traffic increases that signal future profitability. Sustained negative ROI requires strategic pivots.
How do I present social media ROI to stakeholders who don’t understand marketing?+
Focus on clear business outcomes rather than marketing jargon. Present ROI as a simple ratio: for every dollar invested, we generated X dollars in return. Use visual dashboards showing revenue trends, compare social media ROI to other marketing channels, and connect social metrics directly to business goals like sales growth or customer acquisition. Real customer examples and case studies make abstract metrics tangible.